
Ping monitoring
Ping is a first-class citizen, not a bolt-on. It has its own page (/ping), a
live diagnostics panel that streams each sample as it lands, and its own history
chart. It’s deliberately ping-only, so a speed test never perturbs it.
Live diagnostics
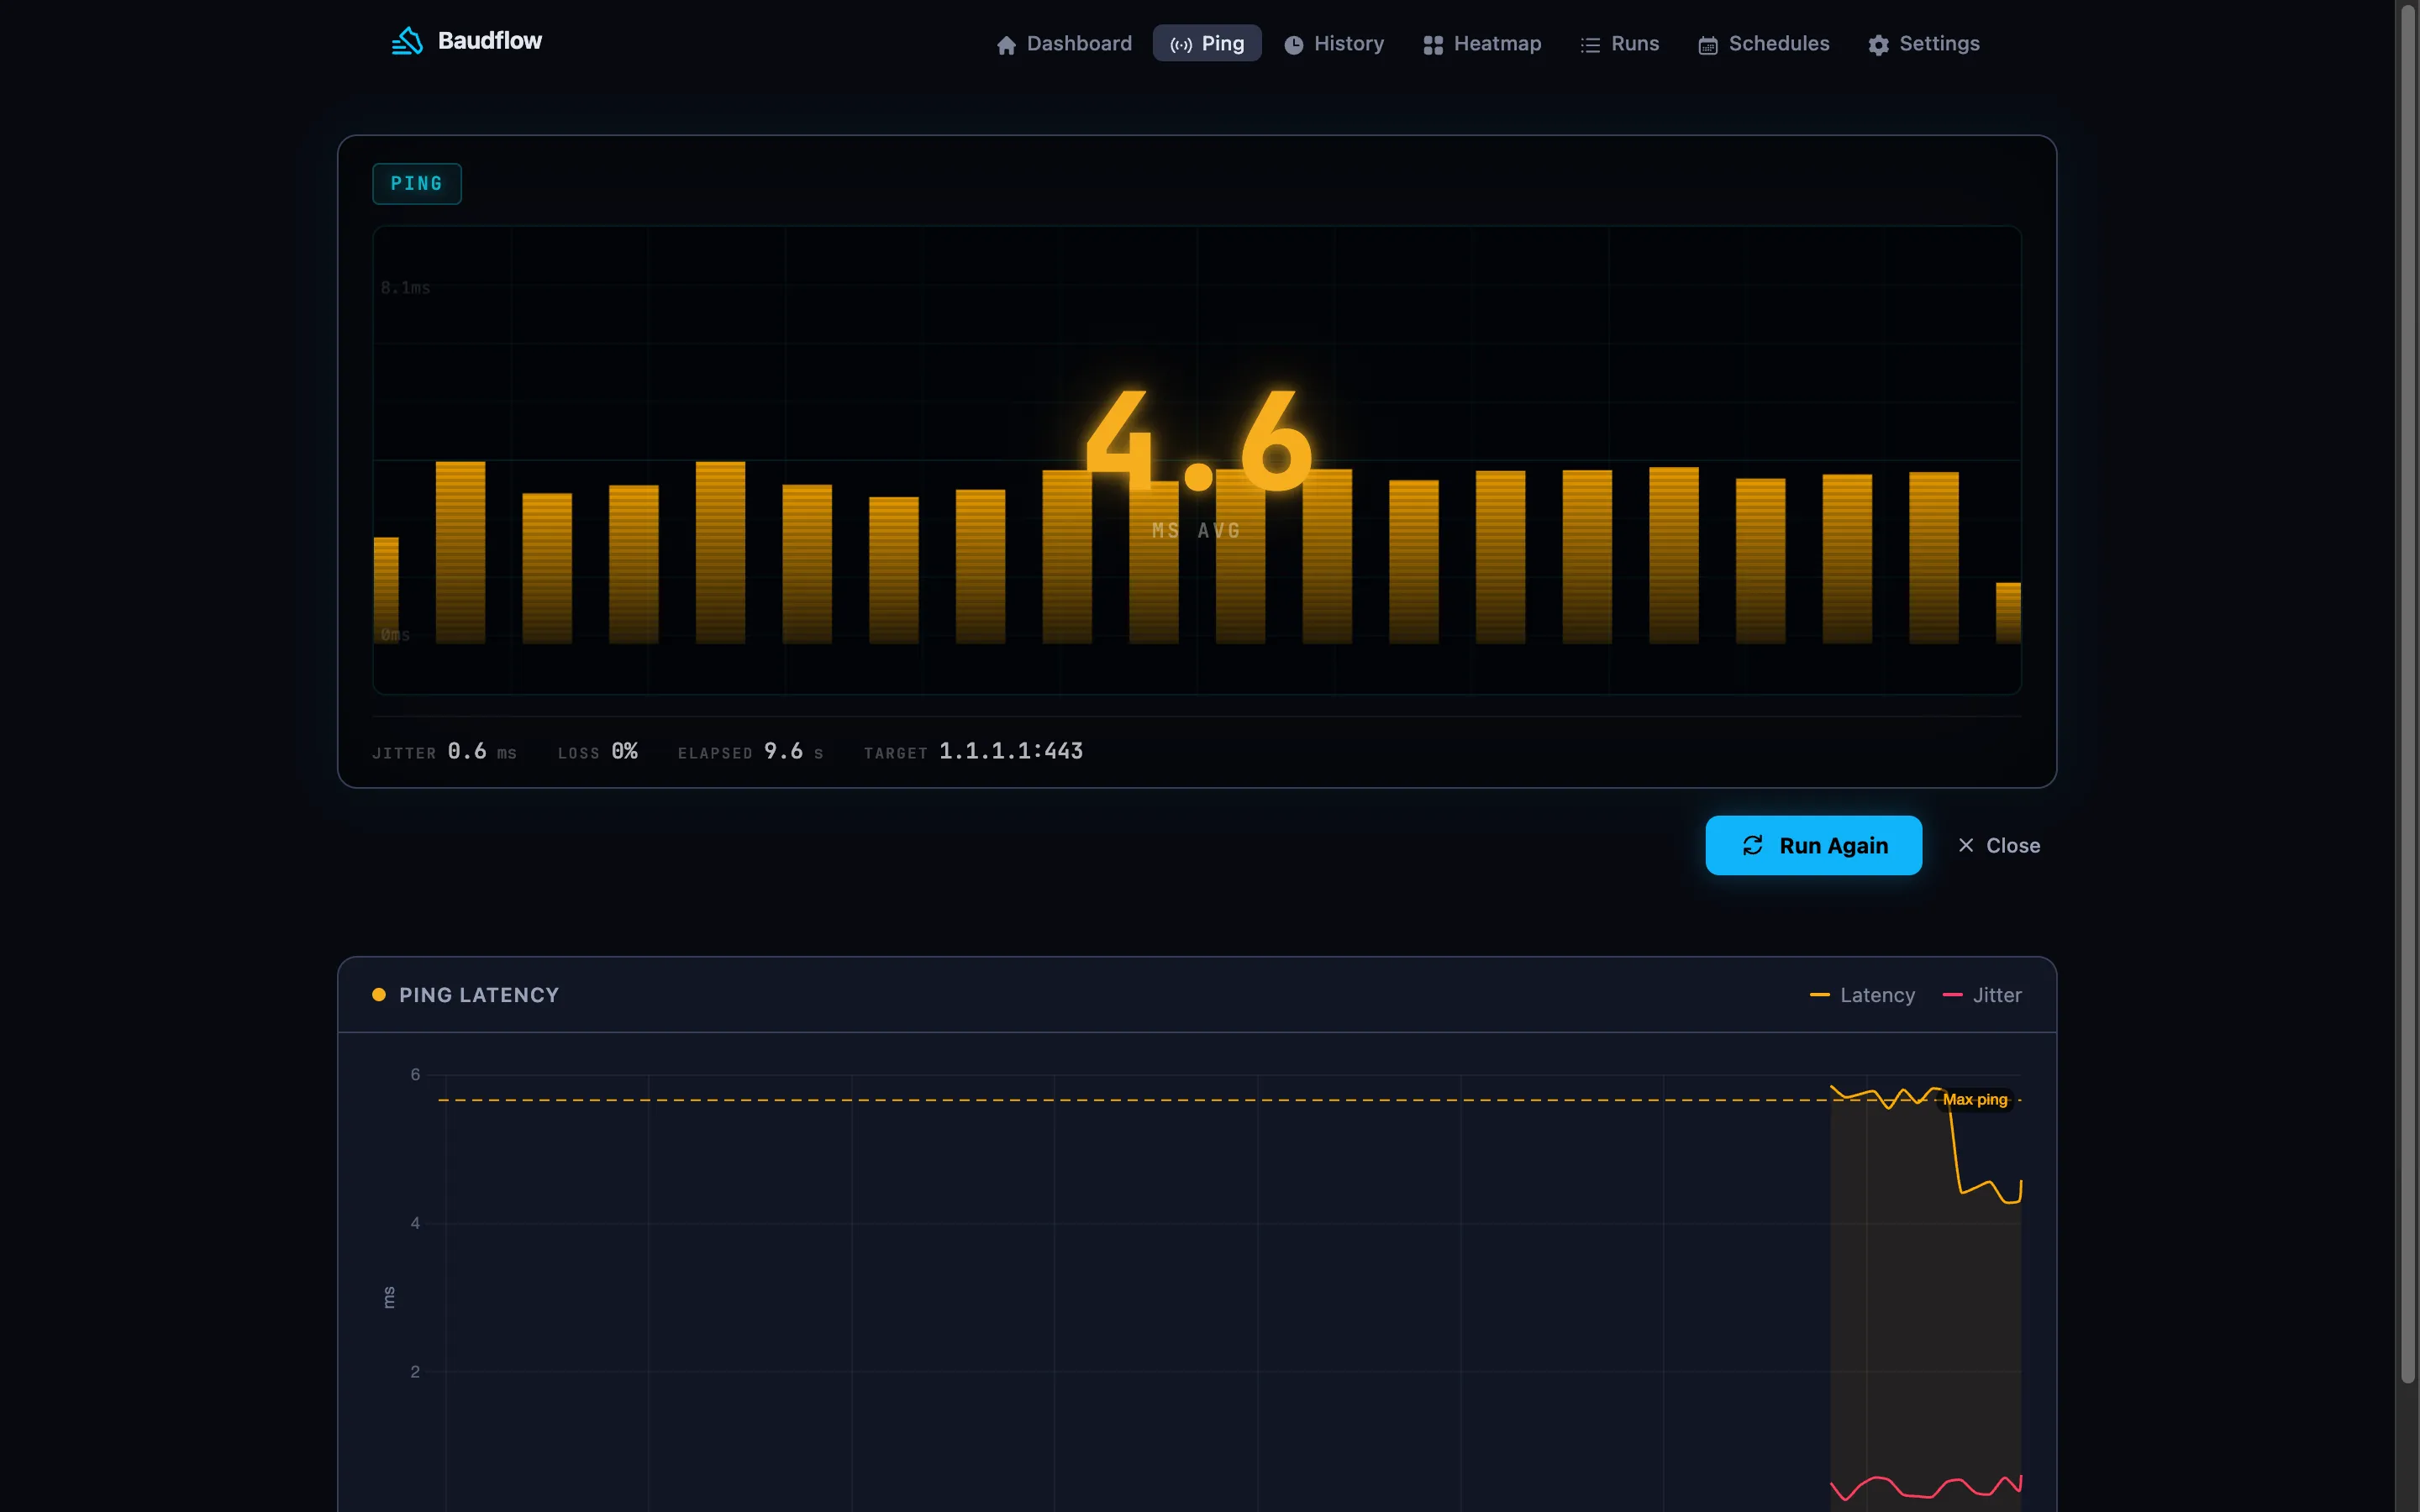
Open the Ping page and run a test. The PingViz panel streams per-sample
progress over PubSub ({:ping_progress, _}): as each sample lands you watch the
cumulative average, jitter, low/high, and packet loss update in real time. When
the run finishes the panel freezes on the final readout until you dismiss it or
run again. You can also launch a ping from the main dashboard’s split button,
which jumps to /ping and starts immediately.
TCP-connect, not ICMP
The ping runner measures TCP-handshake RTT: it opens connections to
host:port at a fixed cadence (2 samples/second) for the configured duration and
treats each completed handshake (~1 RTT) as a latency sample, with failed
connects counted as packet loss. Sampling for a sustained window (default 10 s)
averages many readings into a stable value instead of a noisy burst.
This needs no binary and no CAP_NET_RAW: it works unprivileged under a
locked-down security context where neither the ping binary nor raw-socket
capabilities are available. The tradeoff is the price of entry: a target that
doesn’t speak TCP on the configured port reads as 100% loss.
Targets and ports
A schedule may override the target per row; otherwise the global setting applies:
schedule.target_host || Settings.get("ping_target")        # 1.1.1.1
schedule.target_port || Settings.get_integer("ping_port", 443)
Defaults point at 1.1.1.1:443 (Cloudflare), which always accepts the
connection. Point a schedule at any host:port that speaks TCP.
What a ping result carries
Latency, jitter, low, high, packet loss, and the full raw sample set. It carries no download/upload, so health skips those checks and judges ping on latency alone.