
Getting started
Baudflow is a Phoenix LiveView app backed by PostgreSQL and Oban. Run the prebuilt container image (the Ookla CLI is bundled in) or boot it from source.
Option A: Docker (recommended)
The image is multi-arch (linux/amd64, linux/arm64) and bundles the Ookla
Speedtest CLI, so there’s nothing extra to install:
docker run -d \
  --name baudflow \
  -p 4000:4000 \
  -e DATABASE_URL="ecto://user:pass@host/baudflow" \
  -e SECRET_KEY_BASE="replace-with-a-long-random-value" \
  ghcr.io/v1nvn/baudflow:0.11.8
On first boot the release runs migrations automatically. Open
localhost:4000 and trigger a manual run, or wait for the
scheduler. Only DATABASE_URL and SECRET_KEY_BASE are required; see
Environment variables for the full list.
For a single-command stack that brings up Postgres alongside Baudflow, use the
docker-compose.yml in the repo:
git clone https://github.com/v1nvn/baudflow && cd baudflow
docker compose up
The
:0.11.8tag is the latest release.:latestfollows themainbranch, where new features (like the live ping diagnostics page) land before they’re cut into a tagged release.
See Deployment for production hardening.
Option B: from source
Prerequisites:
- Elixir 1.20+ and Erlang/OTP 29+ (the Dockerfile pins
1.20 / 29.0.1) - PostgreSQL
- The Ookla Speedtest CLI on your
$PATH(only needed for speed tests, since the TCP-connect ping runner needs no binary)
The Ookla Speedtest CLI is a third-party binary; by using it you accept Ookla’s license terms. The image bundles it for convenience. baudflow itself is AGPL-3.0.
git clone https://github.com/v1nvn/baudflow && cd baudflow
mix setup      # install deps, create the database, run migrations
mix phx.server
Or inside an IEx session: iex -S mix phx.server.
What you’ll see
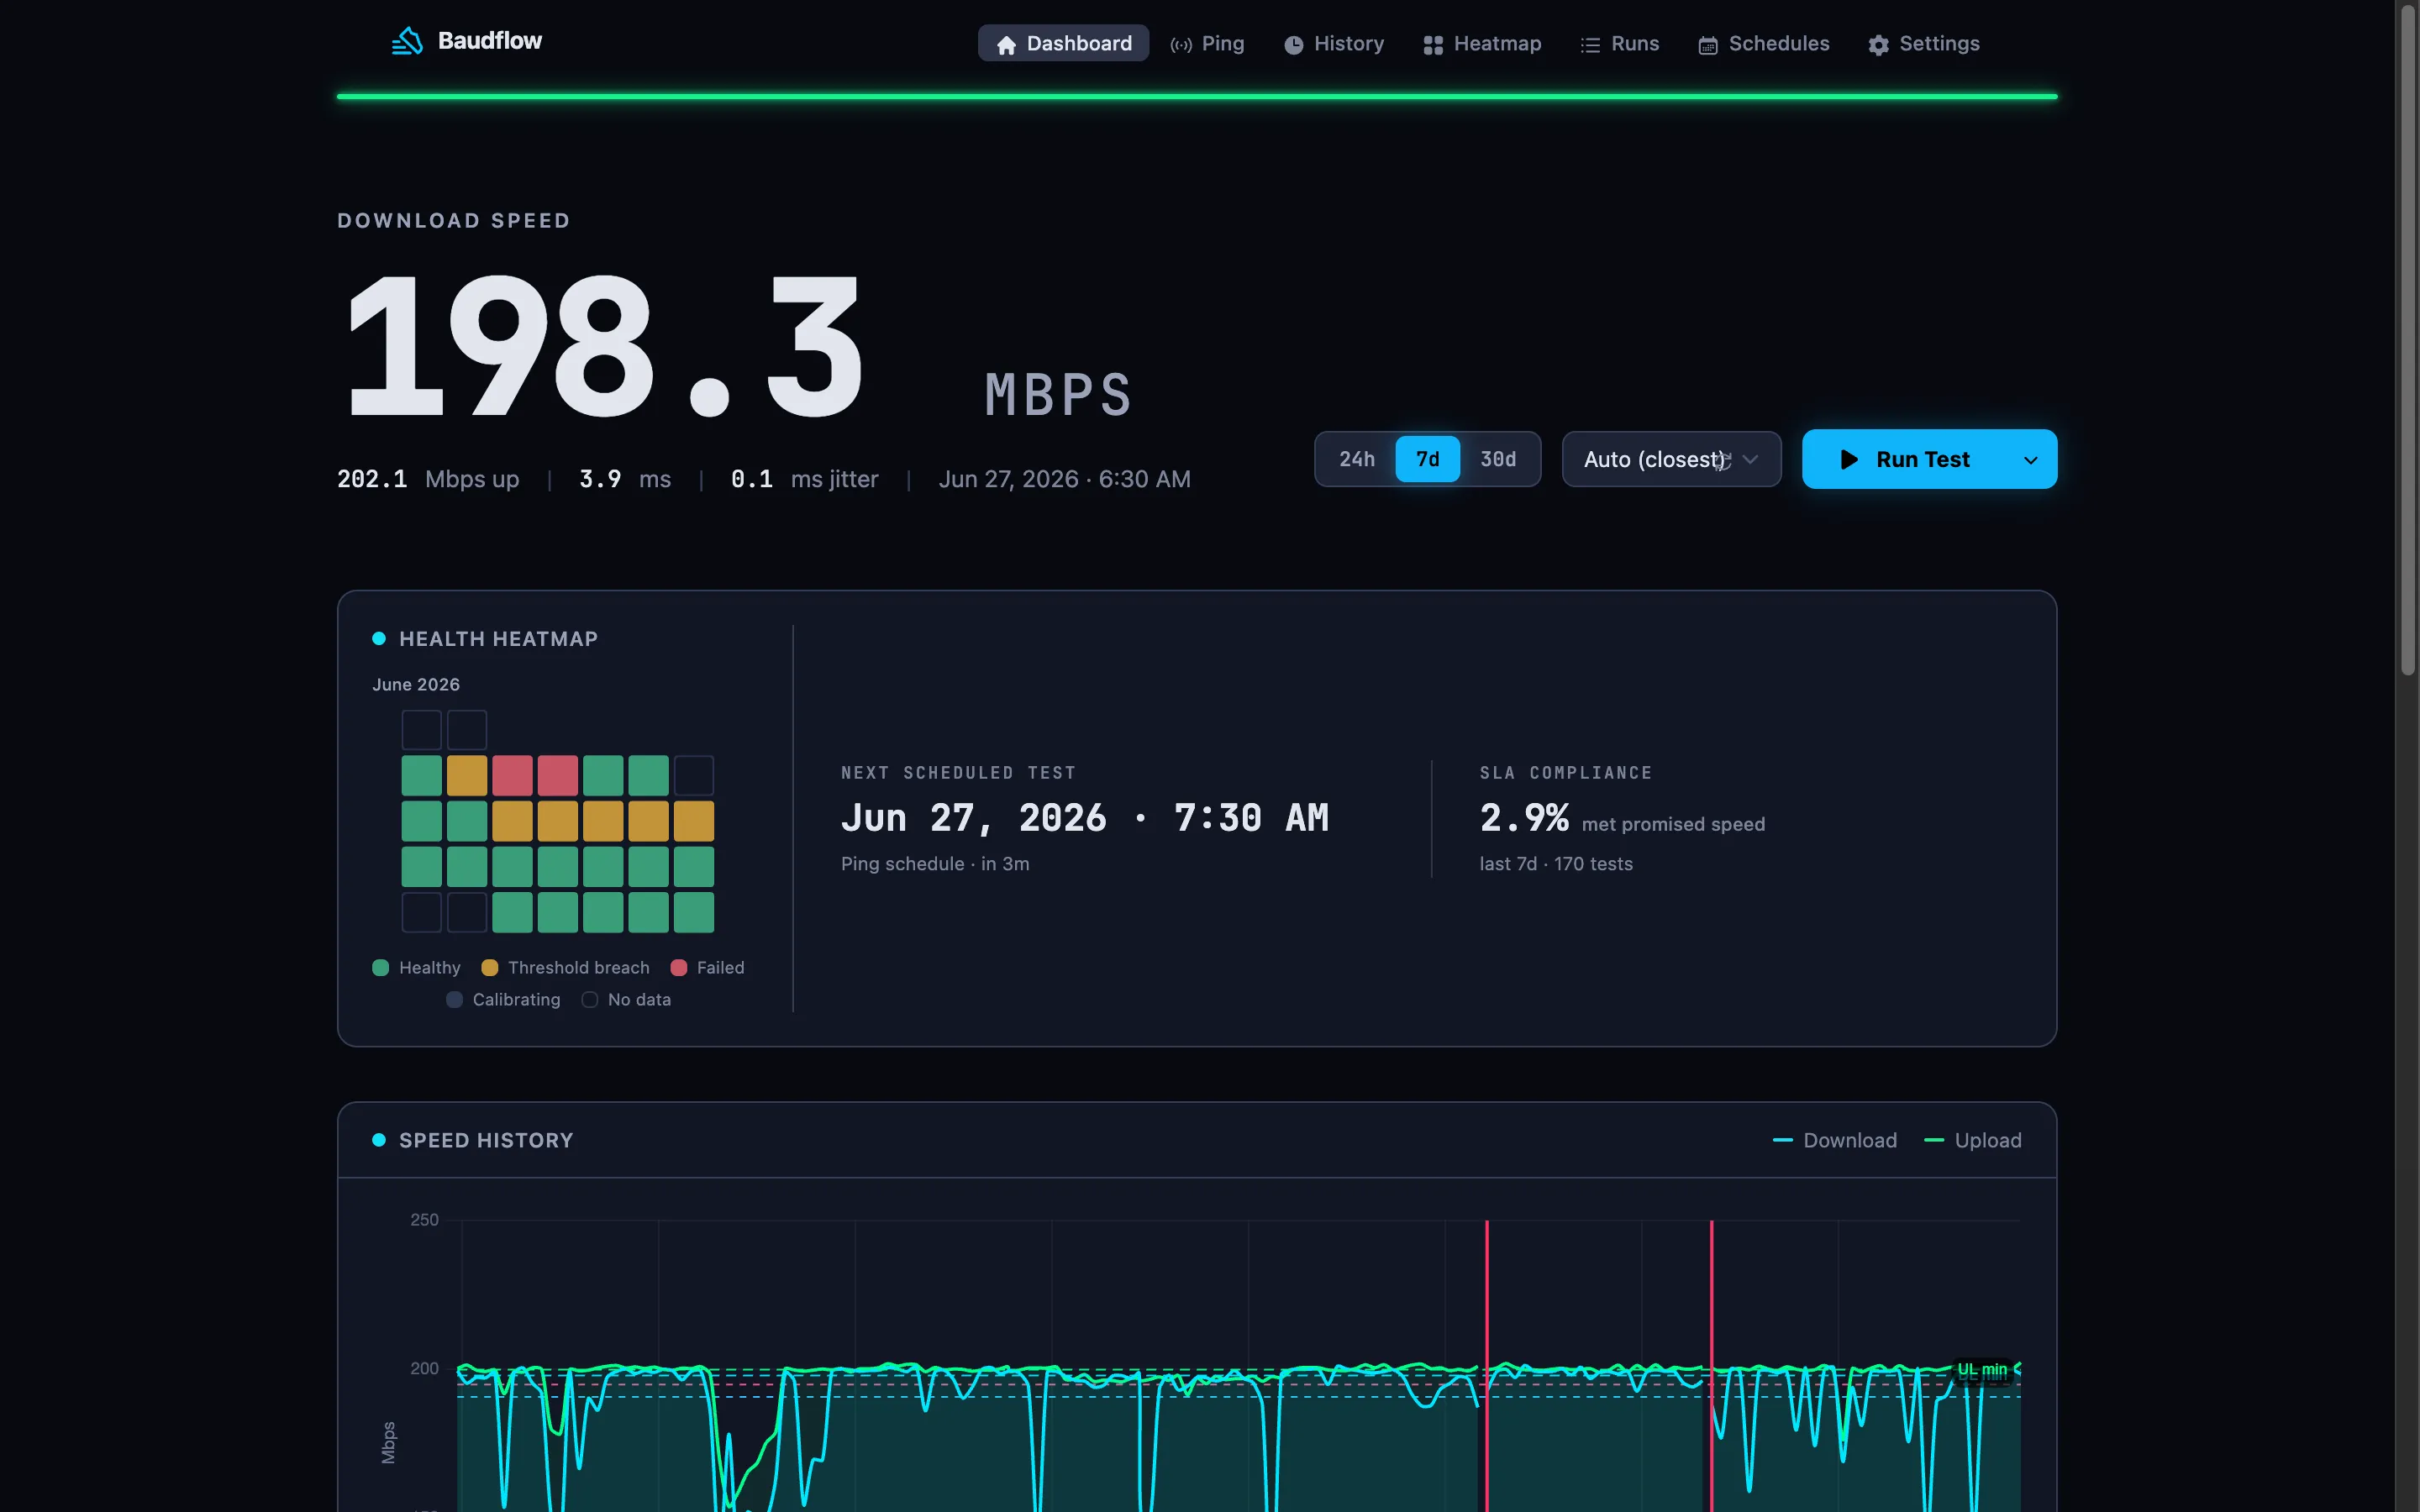
- Dashboard (
/): hero readout, a speed-history chart with threshold lines, an SLA-compliance card, a monthly health heatmap, and a manual Run button. - Ping (
/ping): a dedicated ping console with a live, per-sample diagnostics panel and ping-only history. - History (
/history): every measurement, filterable and sortable. - Schedules (
/schedules): multiple cron schedules, each with its own thresholds and escalation. - Settings (
/settings): thresholds, servers, retention, notifications.
Next steps
- Configure schedules, thresholds, and notifications.
- Add a ping target or wire up alerts.
- See how baudflow compares to speedtest-tracker — the incumbent is broader (Apprise, SQLite, i18n); baudflow trades that for a live dashboard, continuous ping, and SLA tracking.