
Internet speed SLA
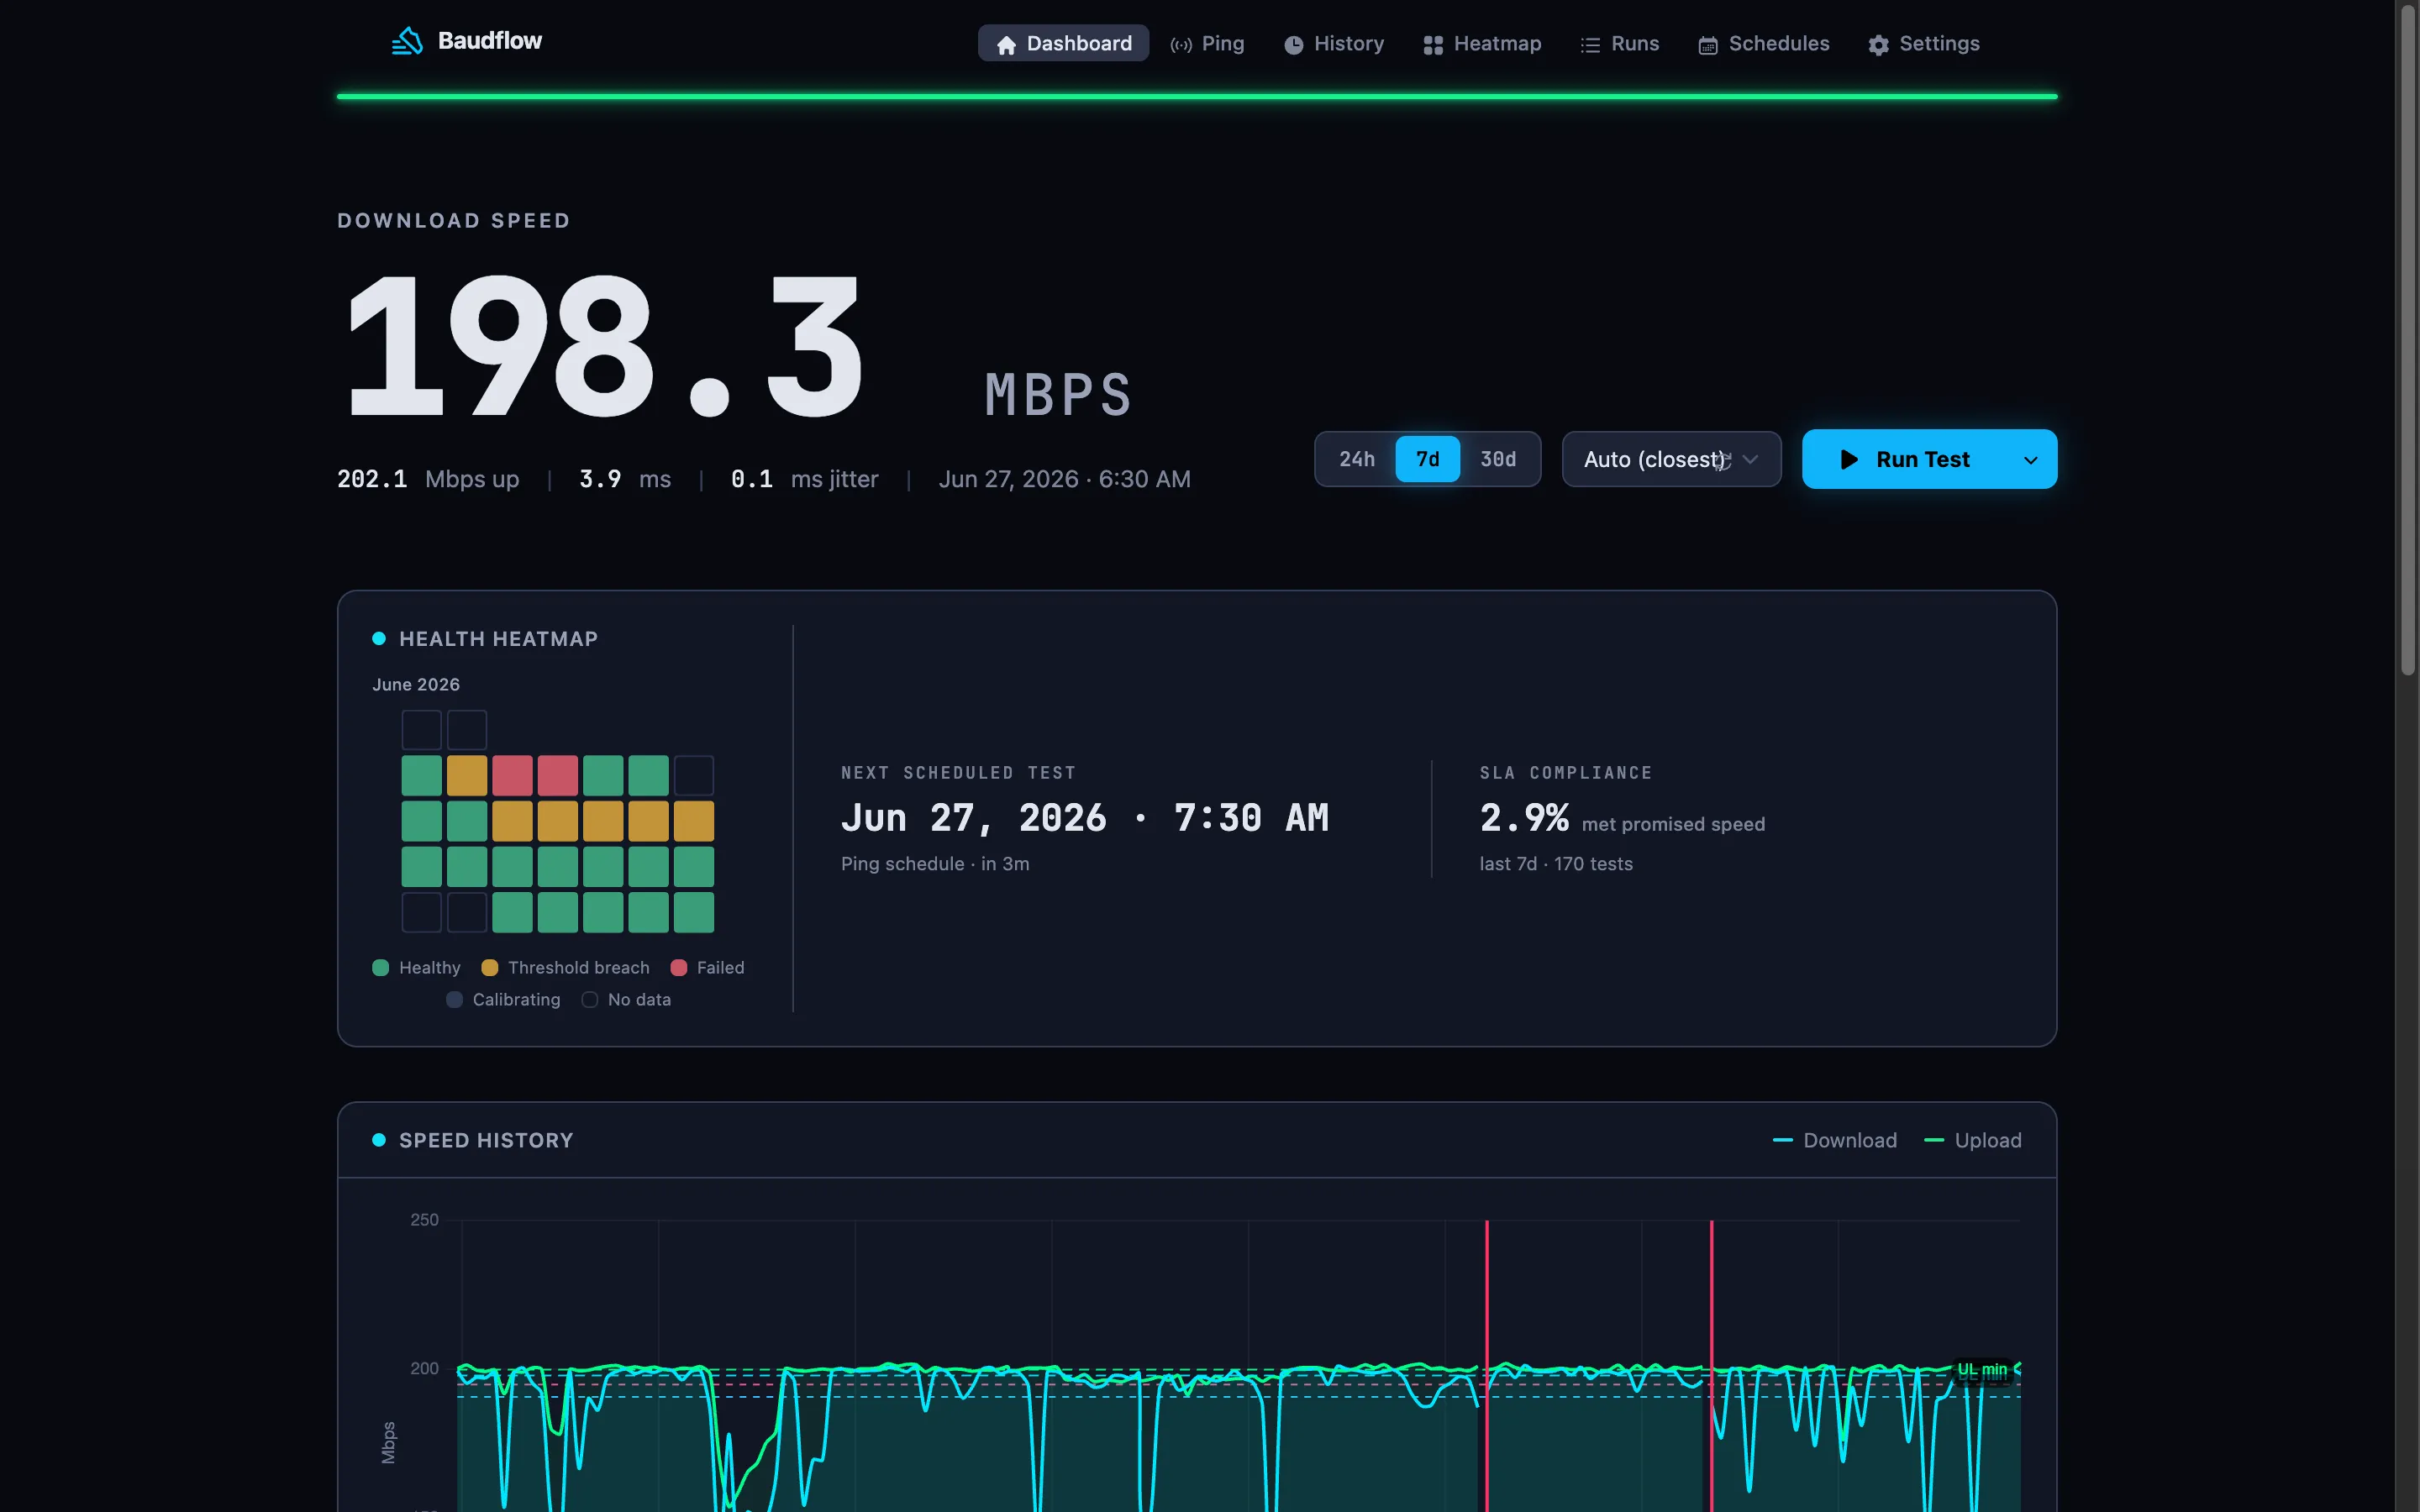
An internet speed SLA, for a home connection, is the share of your speed tests that met the speed you pay for (your plan tier) over a window. Enterprises negotiate SLAs with penalties; consumers get an “up to” speed and no record of how often reality matched it. baudflow closes that gap as a data problem: each scheduled Ookla result is classified met or breached against the Mbps you configure, then aggregated into a figure like “delivered 91.3% of promised speed this month,” with breach streaks and a heatmap of when shortfalls cluster. The SLA is a derived view, not stored data. It is computed on the fly from the raw results and your current thresholds, so changing a threshold re-derives every past month instantly. Nothing is backfilled, nothing is lost, and there is no proprietary scoring behind the number.
How the number is computed
Take every test in the window, compare its download to your promised speed, and
count the fraction that met it. baudflow classifies each result met or
breached against the Mbps figure you set on the schedule (per-row), falling
back to the global default when a schedule doesn’t override it. Both resolve through
one reader (Scheduling.thresholds_for/1), so there’s no second source of the
number. Because the classification runs against a single configured value, the
calculation is transparent and reproducible: the same raw results plus the same
promised speed yield the same percentage, anywhere. Set your promised speed
(promised_download_mbps / promised_upload_mbps) on the
schedule row.
Modes: auto, absolute, or off
The verdict each test gets, and therefore what “met” means, depends on the threshold mode:
auto(default): judges each value against the connection’s own rolling-median baseline. A test breaches when download or upload falls belowratio × median, or when ping exceedsmedian / ratio. While there isn’t enough history the baseline is:insufficientand no verdict is produced. Zero-config; a stable line stays quiet.absolute: draws a hard line in Mbps. Set it to your plan tier and “met” means “hit the speed you pay for.” That’s the SLA case. Download/upload must meet or exceed their threshold; ping must be at or below its threshold.off: disables verdicts entirely; you get raw numbers, no compliance figure.
A check runs only when it has both a threshold and a value: a ping result carries no bandwidth, so its download/upload checks are simply skipped (never an error).
The number to watch is the trend, not a single month: 98% then 91% is telling you something, especially when the shortfalls cluster in the heatmap at the same hour every evening.
Why changing a threshold doesn’t rewrite history
Because the SLA is never written down. Health is a pure function of a measurement
and its thresholds (Baudflow.Health), with no database access of its own, and
the verdict is never stored: every reader (dashboard hero, heatmap,
/metrics, history filter, result detail) derives it just-in-time on the next
read. Every Ookla result is stored in full (download, upload, ping, jitter,
packet loss, server, provider), and the compliance percentage, breach streaks,
and heatmap are all computed from that store on demand. Change your promised
speed or switch from auto to absolute and every past month re-derives under the
new rule the next time you look. Raw data is sacred; derived views are cheap.
Breach streaks and transitions
Baudflow.Health.evaluate/3 also produces a transition against the
schedule’s prior breach streak:
:breach. The first test that fails after a healthy run.:recovered. The first healthy test after a breach.:healthy. Steady healthy.nil. Still breaching, or no verdict.
The streak (breach_streak) and escalation level live on the schedule row and
are mutated only by Scheduling, atomically. That transition is what drives
both adaptive cadence and notifications.
Reading it out
The in-app SLA compliance is against your promised speeds
(promised_download_mbps / promised_upload_mbps), which is distinct from the
baudflow_uptime_percentage gauge exposed at
/metrics; that one reflects threshold-based health,
so it equals the SLA figure only when your threshold is absolute and set to your
promised speed.
For a support thread, export the history chart or screenshot the heatmap; the underlying numbers behind either are the raw retained results. The monitor ISP speed guide covers the wiring.
Next steps
- Monitor ISP speed: scrape
/metrics, embed the heatmap, build the record. - Schedules & adaptive cadence: set promised speeds and breach-driven cadence.
- Self host: deploy it (Docker, Compose, or Kubernetes).